

The first post of this was done on the 17th of March 2020.
Just keeping track of Total cases and deaths for 3 countries of my interest today.
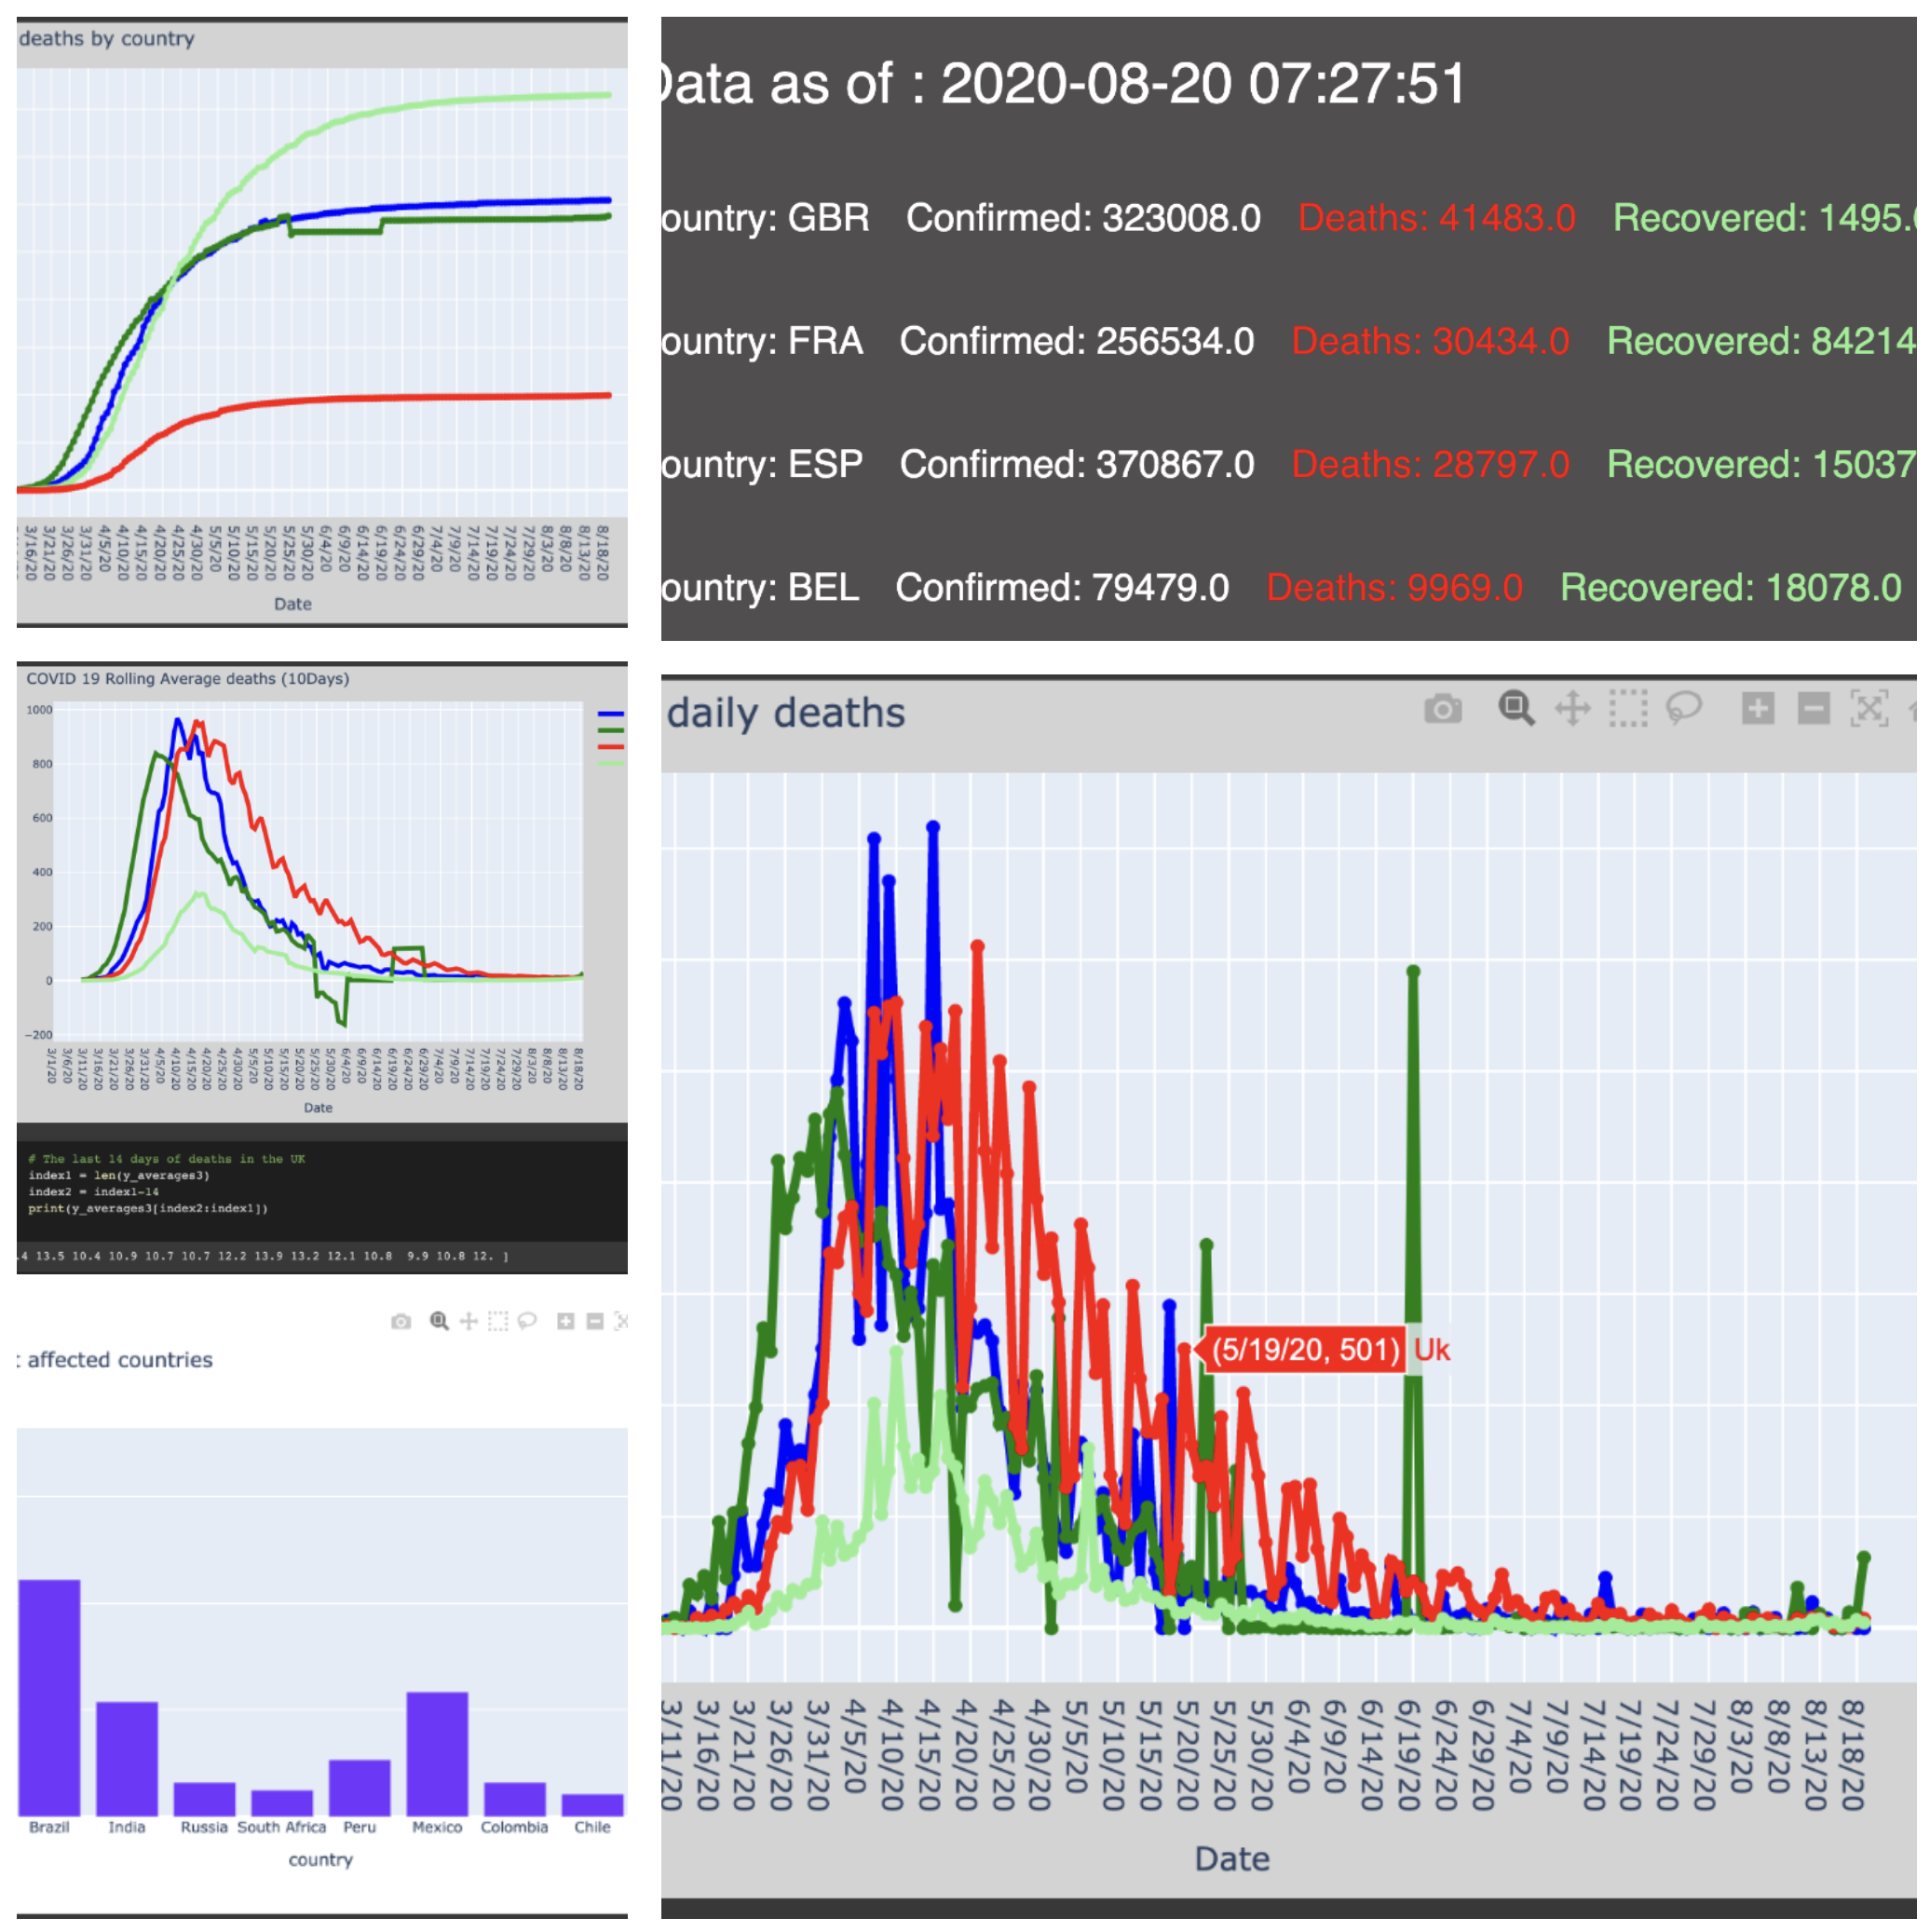
Update 20th August 2020 :
Just back from a holiday in France…going through my 3rd testing for Covid…to protect family and friends and reassure ourselves that we are not sick. Feeling ok but clearly second wave is in progress for European countries.
Still using my Colab code to access the latest data. [here]
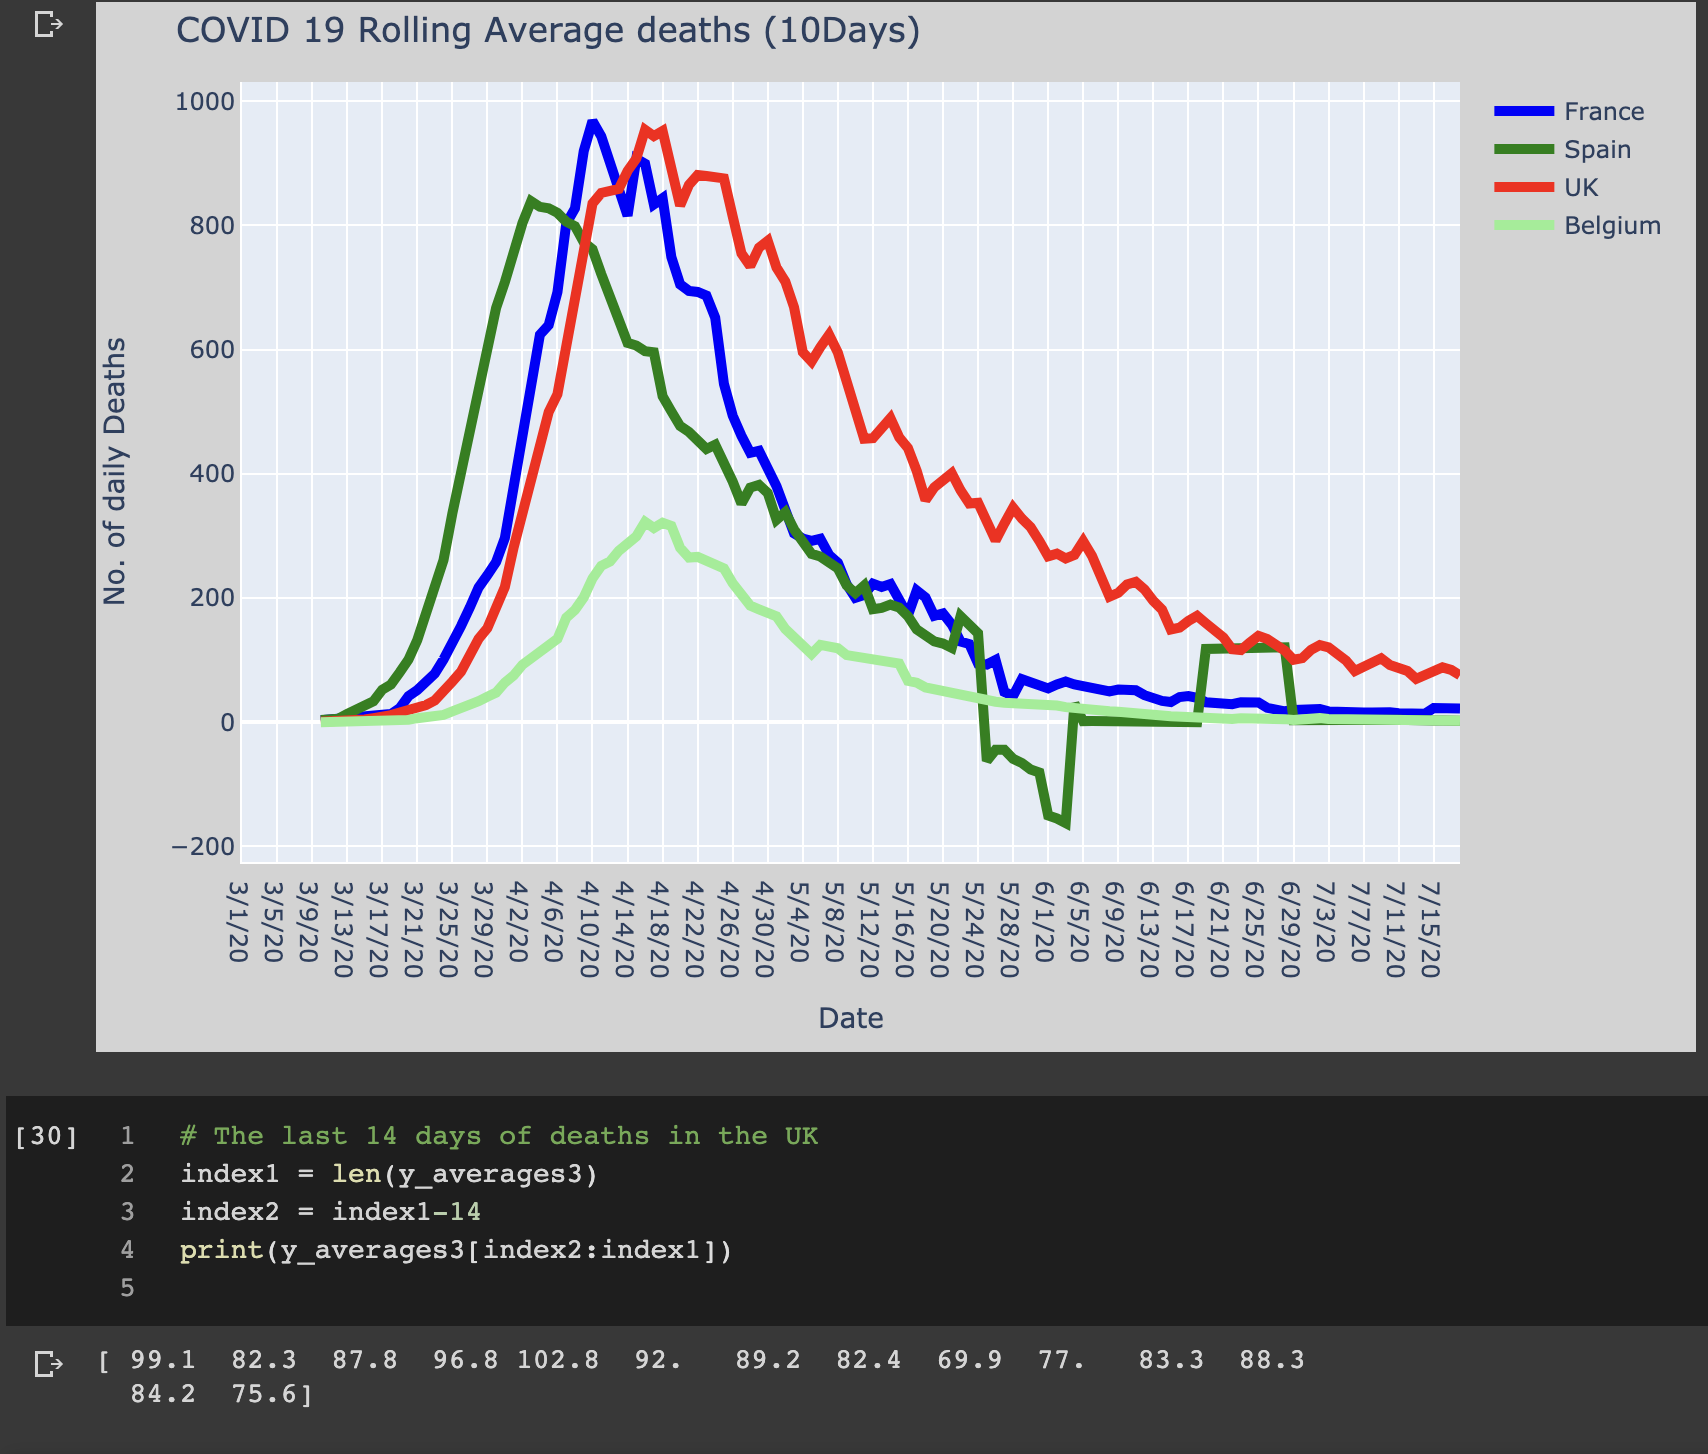
Update 19th July 2020 :
How can anybody say that the UK is out of the crisis !….still 80 to 100 people die daily …I can’t see the flat part of the curve…
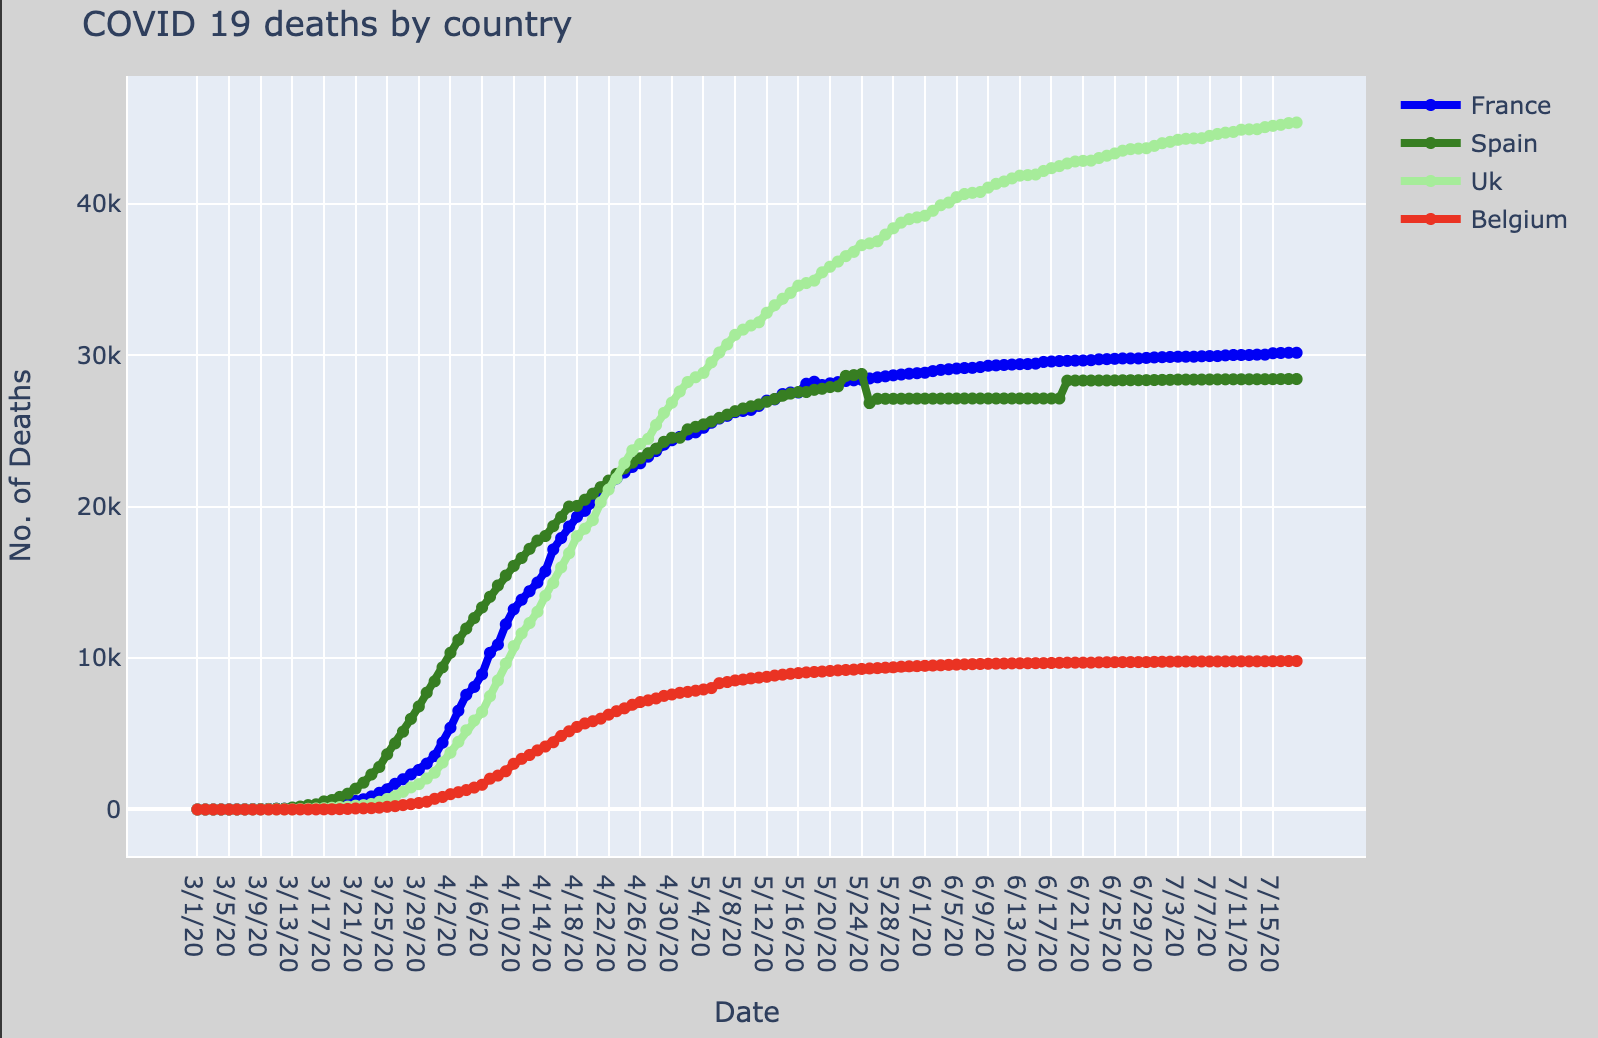
Update April 2020:
I still find the media and the countries governments very poor at providing useful information to the general population. I also continue to struggle to understand the true impact of this virus on our overall deaths levels in the UK.
I remember the BBC posting an idiotic “we have reached 100 death per day” when all scientists were explaining that we were on track to get to 1000 deaths a day. The media was not helping in preparing the population to understand the scale of the problem.
Having said the above, I still do not understand how much more deaths per day did the virus bring to us in comparison to all other diseases we have had in the past. I need to research this.
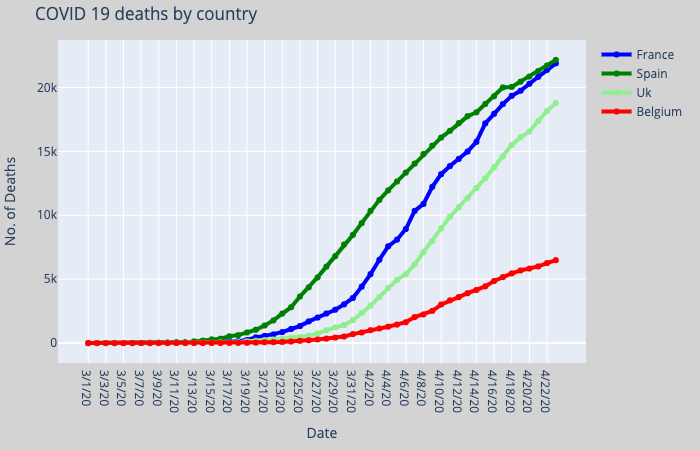
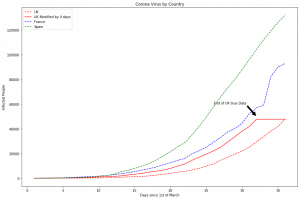
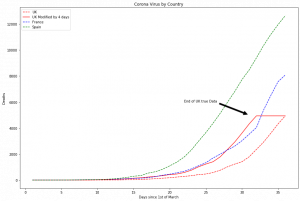
After many updates and searching the internet for the right data, I have decided to build my own tracker using the source data. I used python and google COLAB.
The code in the link will access the source data and make some graphs out of it.
I coded the notebook to plot the countries of my interest.
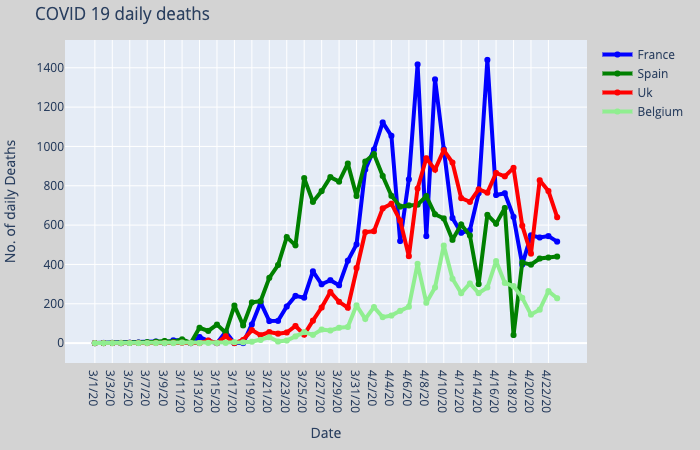
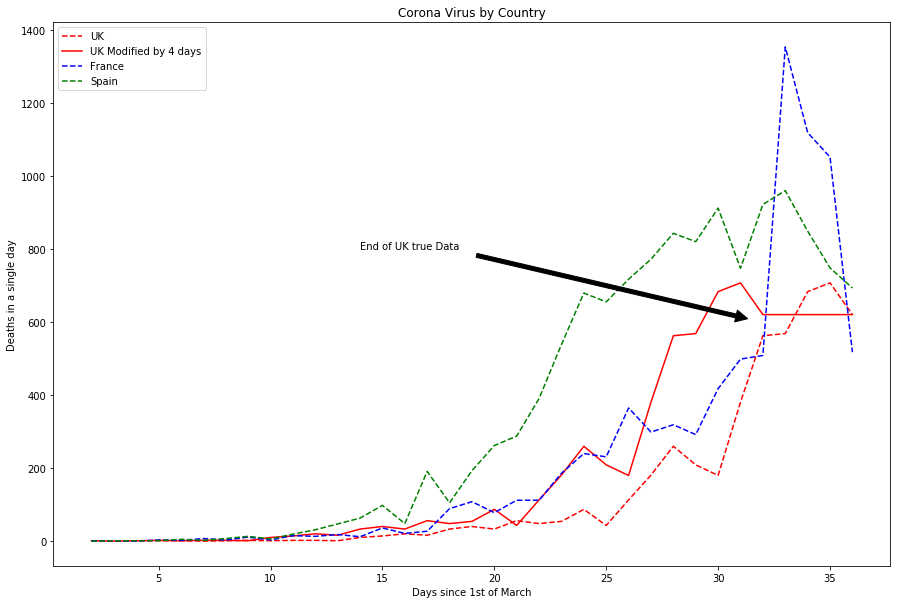
We are currently being told that we might have reached a peak…with 400 people dying daily in the UK I find this obscene.
Status 27th of March 2020:
Getting annoyed by the media system that they are not preparing the population in the UK for what is about to come. We had headlined on BBC website on the 26th saying that we had passed the 100 people dead in a single day. With nothing explaining what to expect in the coming weeks. If we are anything like other European countries we should brace for circa 1000 people dying per day…today 27th…184 dead in the day…no headlines from BBC…maybe they are starting to get it….
A few interesting links :
World number of cases, the best link in my opinion: https://www.worldometers.info/coronavirus/
The FT Graphics : here
The source Data:
https://qap.ecdc.europa.eu/public/extensions/COVID-19/COVID-19.html
A live panel of Data
https://covid19.dsplay.tv?countries=United%20Kingdom%2CFrance%2CSpain%2CBelgium&duration=5
UNited Kingdom Gov Stats : https://www.arcgis.com/apps/opsdashboard/index.html#/f94c3c90da5b4e9f9a0b19484dd4bb14
BBC Cases in your area: https://www.bbc.co.uk/news/uk-51768274
Nice Graphics to explain contagion: https://www.washingtonpost.com/graphics/2020/world/corona-simulator/?fbclid=IwAR1axXapFPLQJbWX1LDgBo9zIMaPs_rdgLvcugvniGdoog17AQNNKe4Sze8
Beds Available: